Building a Full-Stack ERP Intelligence Platform: From Legacy Database to CRM, Treasury & Cable Price Analytics
I built a business intelligence platform that connects a legacy Firebird ERP, Google Sheets, and the WhatsApp Coexistence API into a single Next.js dashboard used daily by an electrical equipment distributor's sales, purchasing, treasury, and management teams. What started as a SQL query runner grew into a 20+ page suite with a Kanban CRM wired to each seller's WhatsApp account, weekly treasury commitments, a cable price comparison tool, and an AI chat assistant that can cross-reference 29+ registered queries from natural language.
Next.js 14 (App Router)TypeScriptReactTailwind CSSFirebird DatabaseSQLChart.jsreact-chartjs-2Google Sheets APIWhatsApp Coexistence APINode.jsPythonlucide-reactXLSX parsing (SheetJS)NextAuth.jsREST APIs4mo ago

Developer of firstcommit.io. I ship with AI and share the journey.
0 followers6 karmaJoined Feb 2026
Build This
8 stages to follow
Paste this in your AI coding tool to build your own version, guided by the approach in this guide.
Build the project from this First Commit guide: 758a9f78-3159-4a1d-874f-ff177c9b33a4No source repo linked — follow the guide stages to build from scratch.
Requires First Commit MCP connected
How it was built
8 stages1
Query System & BI Foundation
The project started by building a modular query engine that could connect to the legacy ERP's Firebird database. Each business intelligence query was made self-contained: its own SQL template file with parameter placeholders, a TypeScript module that registers itself with the system, and typed interfaces for results. The API reads SQL at runtime, performs string replacement for parameters like date ranges and company IDs, then executes against the database. A dynamic frontend generates forms and routing based on query metadata, organized into categories like sales, purchases, inventory, and sales reps. This architecture was critical because it meant any new analysis could be added by creating a folder with no API route changes needed. The initial dashboard presented these as a flat grid of category cards, which later evolved into grouped sections.
~40 messages2
Purchase vs Sales Analysis
The purchasing department needed to understand what they were buying versus what was actually selling, so a comprehensive 5-tab analysis dashboard was built. The first challenge was dirty data — payroll entries and internal transfers were mixed in with product data, so a hideable products system was created where items could be filtered out and the hidden list persisted, ordered by the size of the purchase-sale gap. Next came the immobilization calculation: rather than checking if something sold in a single month, a configurable rolling window (defaulting to 3 months) tracked whether purchased products had any corresponding sales. The temporal evolution tab showed immobilization trends over time using Chart.js. A critical discovery was that the same physical product often appeared under different codes across brands — a product equivalence mapper was built to let users group equivalent items and set unit conversion factors (e.g., 1 box = 100 meters of cable). The family grouping tab aggregated data by product hierarchy. Charts would break when users switched date filters rapidly due to stale React state, which required careful cleanup of chart instances.
~130 messages3
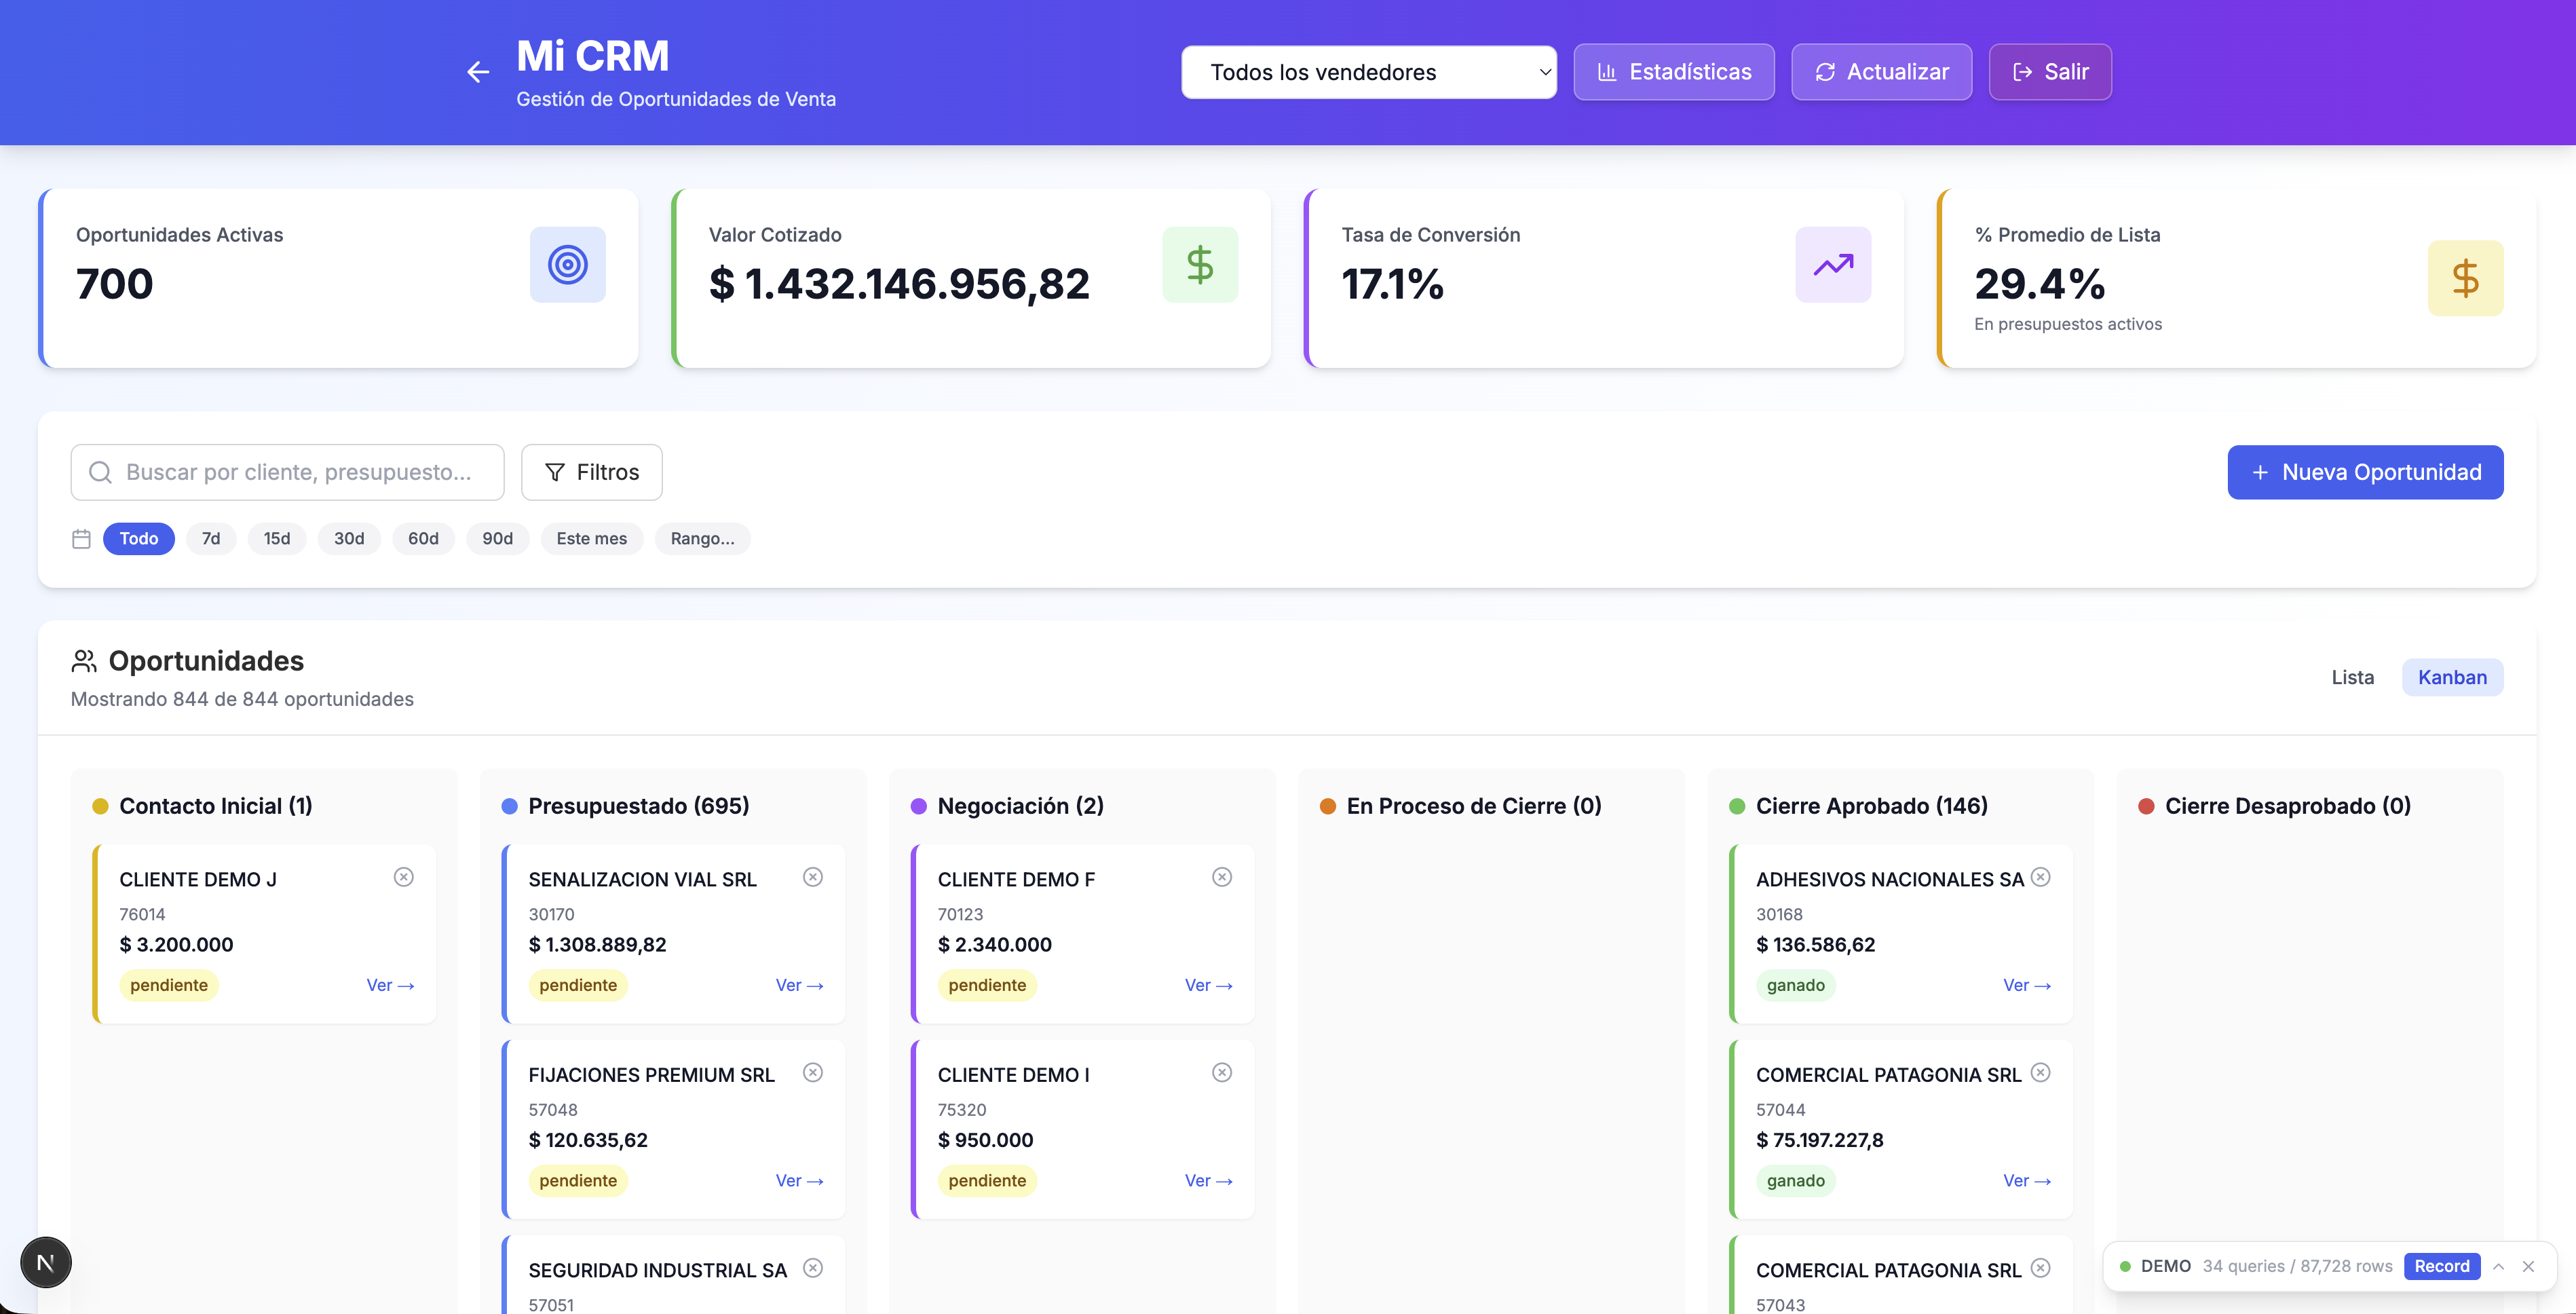
CRM System Development
I built a full CRM from scratch since the company's sales team had no opportunity tracking. The core is a Kanban board with 6+ stages from initial contact through negotiation to approved/rejected closure, plus a later closing-in-progress stage added at stakeholder request. Each opportunity stores flexible metadata including Trello-style colored labels for tagging and a per-seller reminder note field. Metric design was a core part of the work: the Approved This Month KPI uses actual invoice dates rather than when an opportunity was moved to the approved column, and opportunities sitting in closing-in-progress for more than two weeks don't count — both choices prevent month-end gaming of the number. Cancellation volume was decoupled from individual performance scoring because the correlated signal with actual sales output is creation volume, not cancellation rate. Stage history tracking was added to know exactly when each opportunity moved between stages, with backward compatibility for older opportunities that didn't have history. A statistics page shows pipeline analytics with time-per-stage calculations. A complete visual redesign added dark/light mode with corporate branding, and the list view got hideable columns with per-user persistence. Crucially, I integrated the WhatsApp Coexistence API: each salesperson links their own WhatsApp Business account via Meta's Embedded Signup, every conversation binds to a CRM opportunity, and sellers can read, reply, attach media, and fire templated follow-ups from inside the CRM. Each account is scoped to its owner, and outbound messages respect the 24-hour customer-care window with template fallback.
~200 messages4
Treasury & Financial Tools
A treasury section was created with three main tools: a cash flow calendar, a weekly payment commitments page, and a tax position page. The weekly commitments page was the most complex, aggregating three very different data sources into a unified view. Company-issued checks came from a Google Spreadsheet rather than the database because the spreadsheet had better data quality. Invoices due required split payment logic — dividing amounts by the number of installments (up to 5 payment dates per invoice), matching the exact same calculation already used in the cash flow calendar. Payroll estimation was the trickiest: employee salary data was stored in the ERP as supplier invoices rather than in a dedicated payroll table, requiring creative filtering to identify which invoices were actually salaries. The estimation uses a 25th-to-25th date window from the previous month to predict current month obligations. Professional fees were separated from salaries using different document type filters. A stakeholder requested that all data appear on a single page without refreshing when switching between tabs.
~100 messages5
Collections & Commissions
Two separate pages — client debt tracking and installer commission tracking — were merged into a unified collections page after realizing the same person used both. The commission tracking system allows editing individual balance amounts for partial payments (rounding to avoid floating-point display issues), and has a discard button for excluding entries. A percentage discount is automatically applied for certain payment terms before calculating the commission. The installer data source was completely rewritten: the original approach used a stored procedure with undocumented single-character flag parameters. After trying to reverse-engineer the flags, the decision was made to write direct SQL joins instead. A search filter was added for quickly finding specific clients. The default commission rate was set to 10% based on company policy.
~60 messages6
Cable Price Comparison Tool
The company was comparing cable prices across suppliers using a massive Google Spreadsheet with 17 sheets. This was completely replaced with an in-app solution. The new tool supports importing supplier price lists from XLSX files, with each import creating a new page in the comparison system. Dead stock detection highlights products with no sales in 7+ months, pulling real stock levels from the ERP via automatic synchronization on page load. Column filters mimicking spreadsheet-style dropdowns were added to all table columns. A row selection feature lets users click multiple rows and see summed values above the table. Certification data tracking which products have electrical safety certifications was originally imported from Google Sheets and needed to be preserved when new XLSX imports happened. Sales rotation tracking shows monthly breakdown with the ability to filter and sum selected rows.
~120 messages7
Admin Panel & Persistence Hardening
An admin panel was built with user management including page-level access permissions — each user can be granted access to specific dashboard pages. The persistence layer was upgraded to an embedded SQL store with a controlled migration path: per-file verification with record-count comparison, cross-backend diffs, and an operator toggle to de-risk the transition. Security posture was reviewed end-to-end during this stage: environment-based configuration for all identifiers, CSRF protection across state-changing routes, and environment-aware redirect URLs for authentication flows. Defensive handling was added for older config objects that predated new permission fields so user administration stayed stable across schema evolution.
~80 messages8
AI Chat Assistant
I added an AI chat assistant on top of the query system so business users could ask natural-language questions across the full catalog of dashboards — sales, purchases, inventory, treasury, commissions — without having to remember which page held which metric. The chat exposes a flexible query function that can dynamically dispatch to any of the 29+ registered queries and cross-reference results. Coverage was the hard part: early versions could only reach a subset of queries, so the dispatcher was refactored to enumerate the full registry. I evaluated machine learning and regression analysis for predictive features but concluded the data was too sparse and seasonal for reliable forecasts at this scale, so I focused on what produced clear product value: fast cross-query lookups across the existing analytical surface.
~95 messagesComments
No comments yet
Developer of firstcommit.io. I ship with AI and share the journey.
0 followers6 karmaJoined Feb 2026
Build This
8 stages to follow
Paste this in your AI coding tool to build your own version, guided by the approach in this guide.
Build the project from this First Commit guide: 758a9f78-3159-4a1d-874f-ff177c9b33a4No source repo linked — follow the guide stages to build from scratch.
Requires First Commit MCP connected
More like this
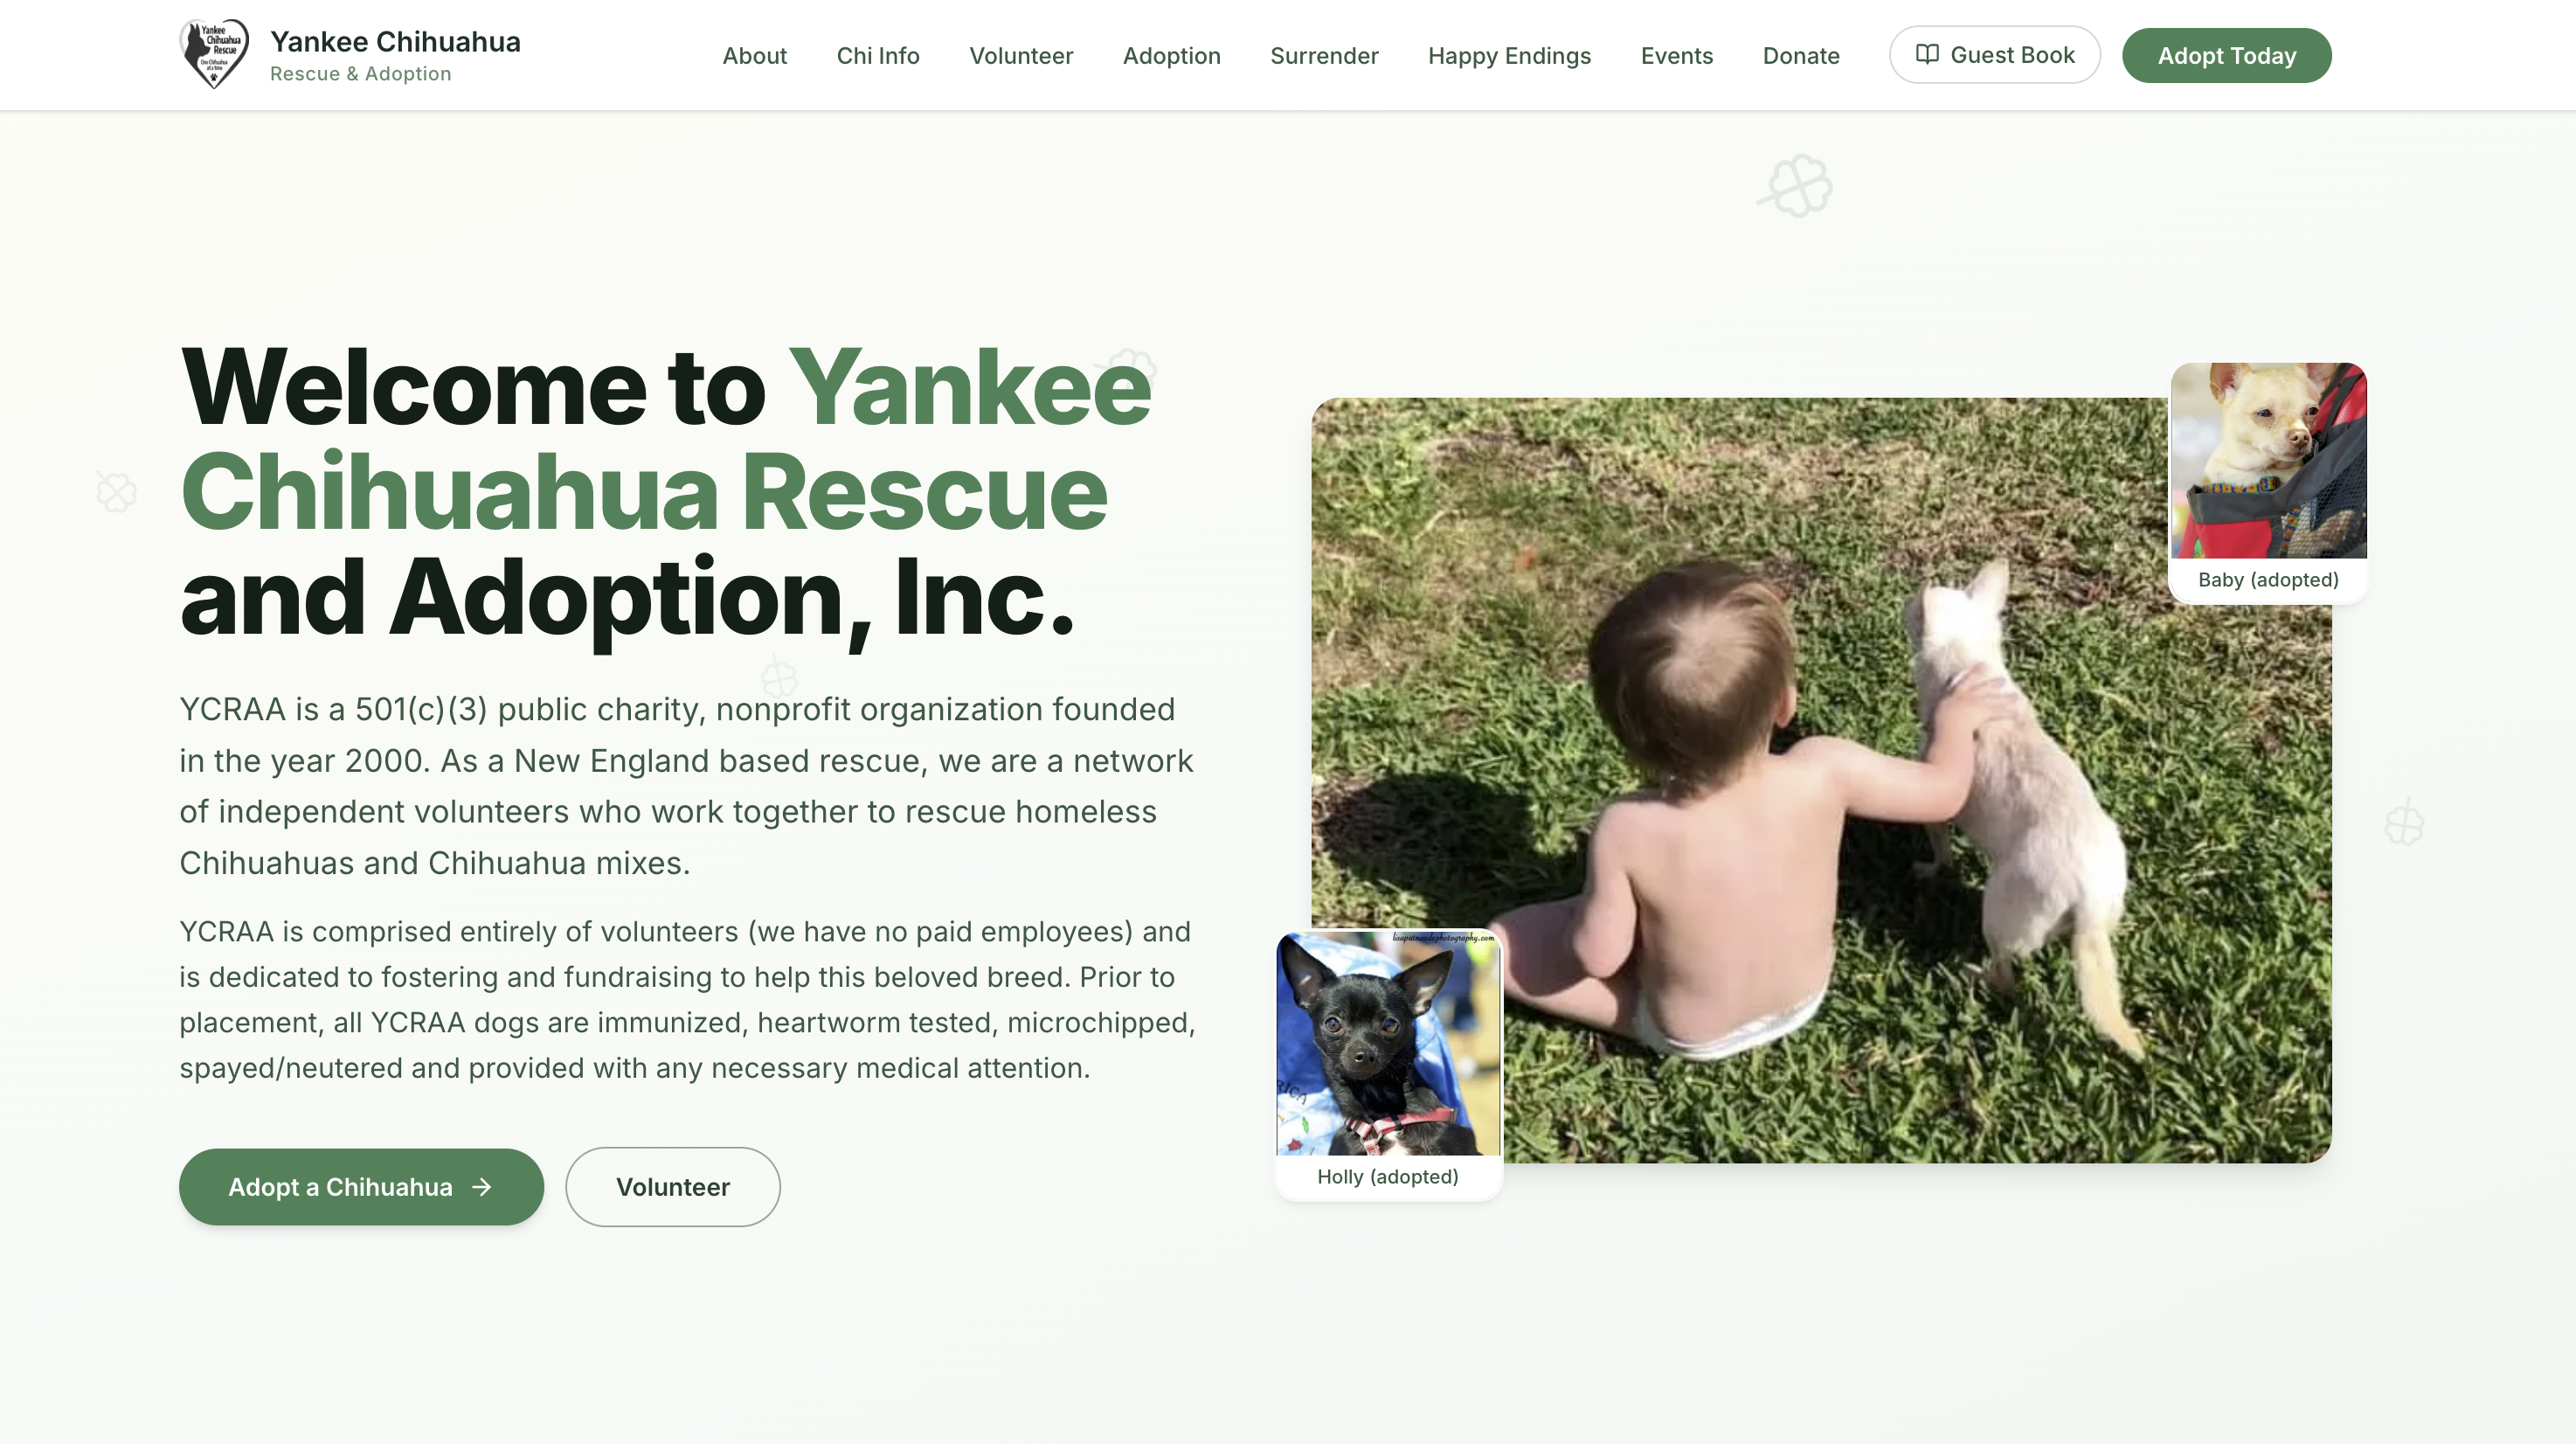
Rebuilding a Dog Rescue Website from Scratch: Scraping, Crawling, and Modernizing Yankee Chihuahua Rescue
04mo ago
B
Building First Commit: A Platform Where Coders Share What They Build
04mo ago
B
Building Argentina's Bloomberg Terminal for Cattle Auctions
04mo ago
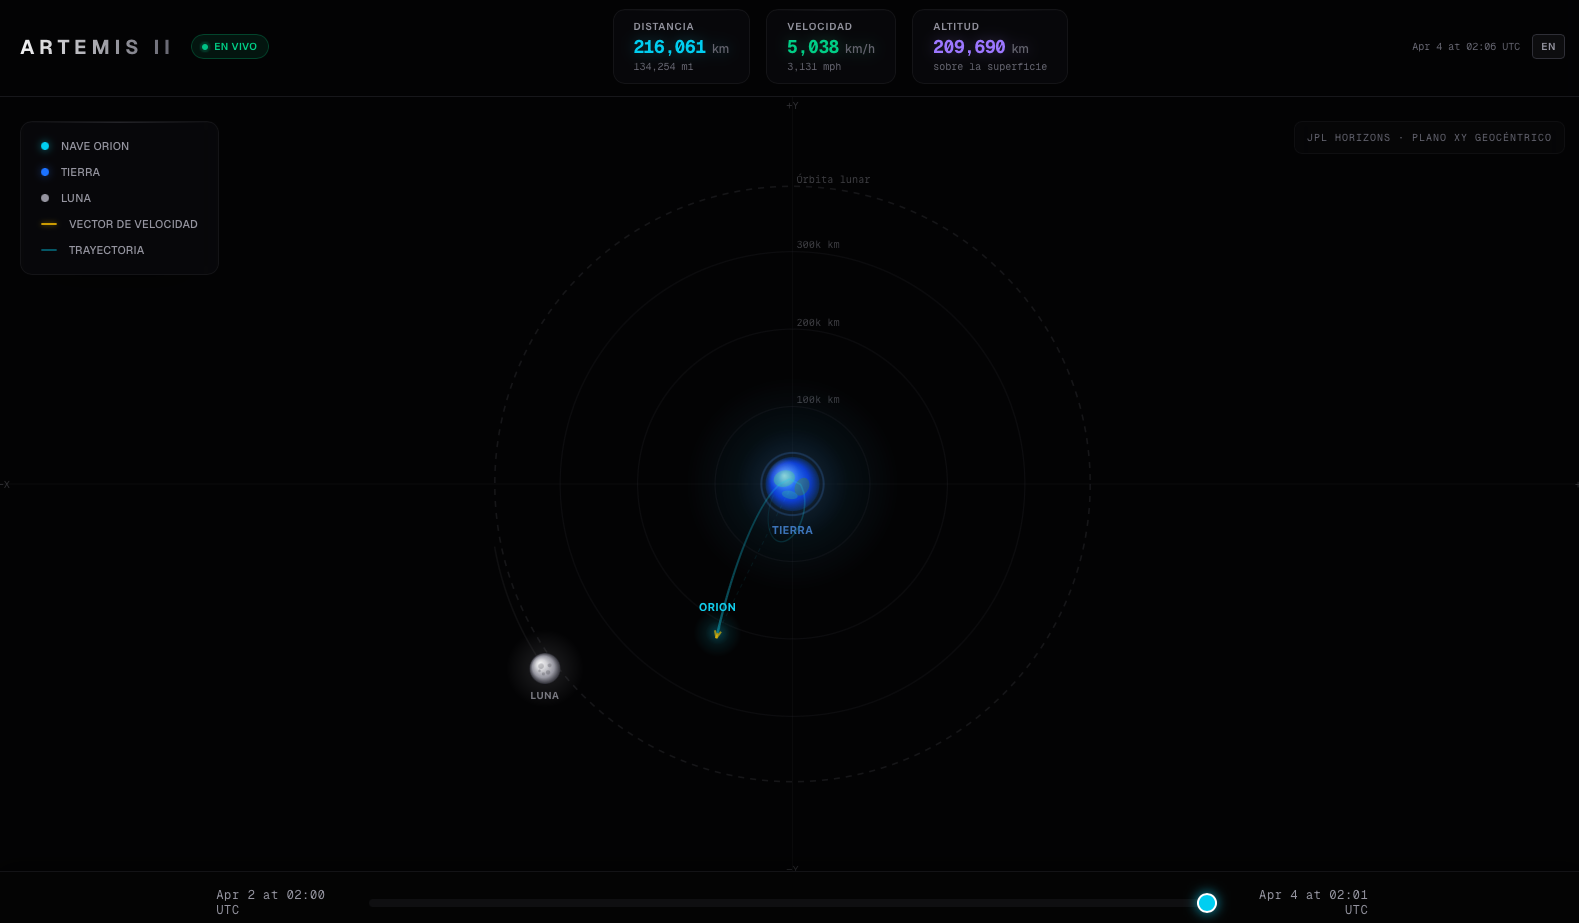
Building a Real-Time Artemis II Orbital Tracker with NASA's JPL Horizons API
03mo ago

Prisma Público: crossing 3 gov datasets to find interesting data insights
02mo ago
More like this
Rebuilding a Dog Rescue Website from Scratch: Scraping, Crawling, and Modernizing Yankee Chihuahua Rescue
04mo ago
B
Building First Commit: A Platform Where Coders Share What They Build
04mo ago
B
Building Argentina's Bloomberg Terminal for Cattle Auctions
04mo ago
Building a Real-Time Artemis II Orbital Tracker with NASA's JPL Horizons API
03mo ago
Prisma Público: crossing 3 gov datasets to find interesting data insights
02mo ago