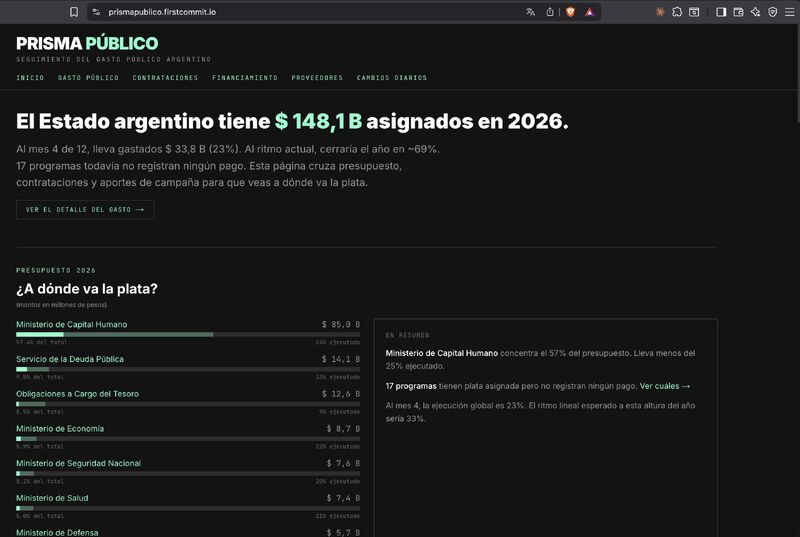
Prisma Público: crossing 3 gov datasets that weren't meant to talk to each other
What happens when you cross Argentina's national budget, 110K public contracts, and 74K campaign donations into one tool. Scraping ASP.NET ViewState, normalizing 11 years of inflation, and the long war against Vercel to make it all load on mobile.
prismapublico.firstcommit.ioSebah40/prisma-publicoNext.js 16React 19TypeScriptPostgreSQLpg (node-postgres)SupabaseTailwind CSS v4VercelCanvas APINode.jsASP.NET ViewState scrapingCSV parsingxlsxINDEC IPC APIdatos.gob.ar APIsISR cachingOAuth 2.04d ago

Developer of firstcommit.io. I ship with AI and share the journey.
0 followers6 karmaJoined Feb 2026
Build This
11 stages to follow
Paste this in your AI coding tool to build your own version, guided by the approach in this guide.
Build the project from this First Commit guide: a059c65a-6cf9-40d2-adf9-dc86ac133732Requires First Commit MCP connected
How it was built
11 stages1
Data source discovery
Mapped Argentina's public data landscape: SITIF (national budget, JSON), COMPR.AR (procurement, ASP.NET portal), CNE (campaign donations, CSV). Got an API token from Presupuesto Abierto, wrote in a rule: don't hammer the server.
~80 messages2
Industrial UI + database setup
Built the terminal-aesthetic Next.js shell with Tailwind. Dark canvas, 1px borders, monospace tables, no rounded corners. Set up Supabase tables for budget snapshots, providers, and historical adjudications.
~100 messages3
Daily Pulse + delta engine
Built the cron-driven ingestion that snapshots SITIF daily. Each snapshot is immutable. The diff engine compares against yesterday and emits BOOST/HALT/RECT events so journalists can spot overnight changes.
~120 messages4
Budget UI funnel (macro → micro)
Three-level navigation: treemap of jurisdictions, filterable table of programs with computed columns (gap de gestión, aumento discrecional), and per-program dossier with historical timeline. Deep-linkable URLs.
~150 messages5
COMPR.AR ASP.NET scraping
Built a resumable multi-worker scraper for the DevExpress/ViewState-heavy COMPR.AR portal. Five parallel sessions, cookie juggling, PostBack simulation. Pulled 110K adjudications from 2015-2026.
~220 messages6
Identidades + CNE + inflation
Added provider profiles linking historical contracts to 2026 budget programs. Imported 74K campaign donations from CNE. Built inflation normalization from INDEC's IPC series (119 months).
~180 messages7
7 custom canvas charts
Built seven insight visualizations on raw Canvas with custom hit detection: distribution histogram, fraccionamiento scatter, boxplot by procedure, before/after donation, provider×organism heatmap, cumulative timeline, co-occurrence network. No chart libraries.
~200 messages8
Data integrity pass
Caught seven systemic data-quality issues: ARS/USD mixing in aggregations, tipo_procedimiento accent variants, missing inflation-adjusted totals, NULL date handling, IPC out-of-range dates, empty histogram bins, ambiguous unit labels. Fixed all of them with DB migrations and query changes.
~100 messages9
Vercel deployment war
Site worked locally, 500'd on production. Through five separate bugs: connection pool limits, env var trailing whitespace, Supabase REST client returning HTML, pg returning numerics as strings, pg returning dates as Date objects instead of ISO strings.
~180 messages10
Mobile-first redesign
Audited 23 files for mobile issues: 8-9px fonts, 6-column grids on 375px screens, percentage-width treemaps, accidental chart taps. Fixed everything in parallel across pages and chart components.
~150 messages11
ISR caching + author credit
Switched all pages from force-dynamic to revalidate = 3600 (novedades at 1800) so the DB gets hit once per hour per page instead of every request. Added author credit and firstcommit.io link to footer.
~30 messagesComments
No comments yet
Developer of firstcommit.io. I ship with AI and share the journey.
0 followers6 karmaJoined Feb 2026
Build This
11 stages to follow
Paste this in your AI coding tool to build your own version, guided by the approach in this guide.
Build the project from this First Commit guide: a059c65a-6cf9-40d2-adf9-dc86ac133732Requires First Commit MCP connected
More like this
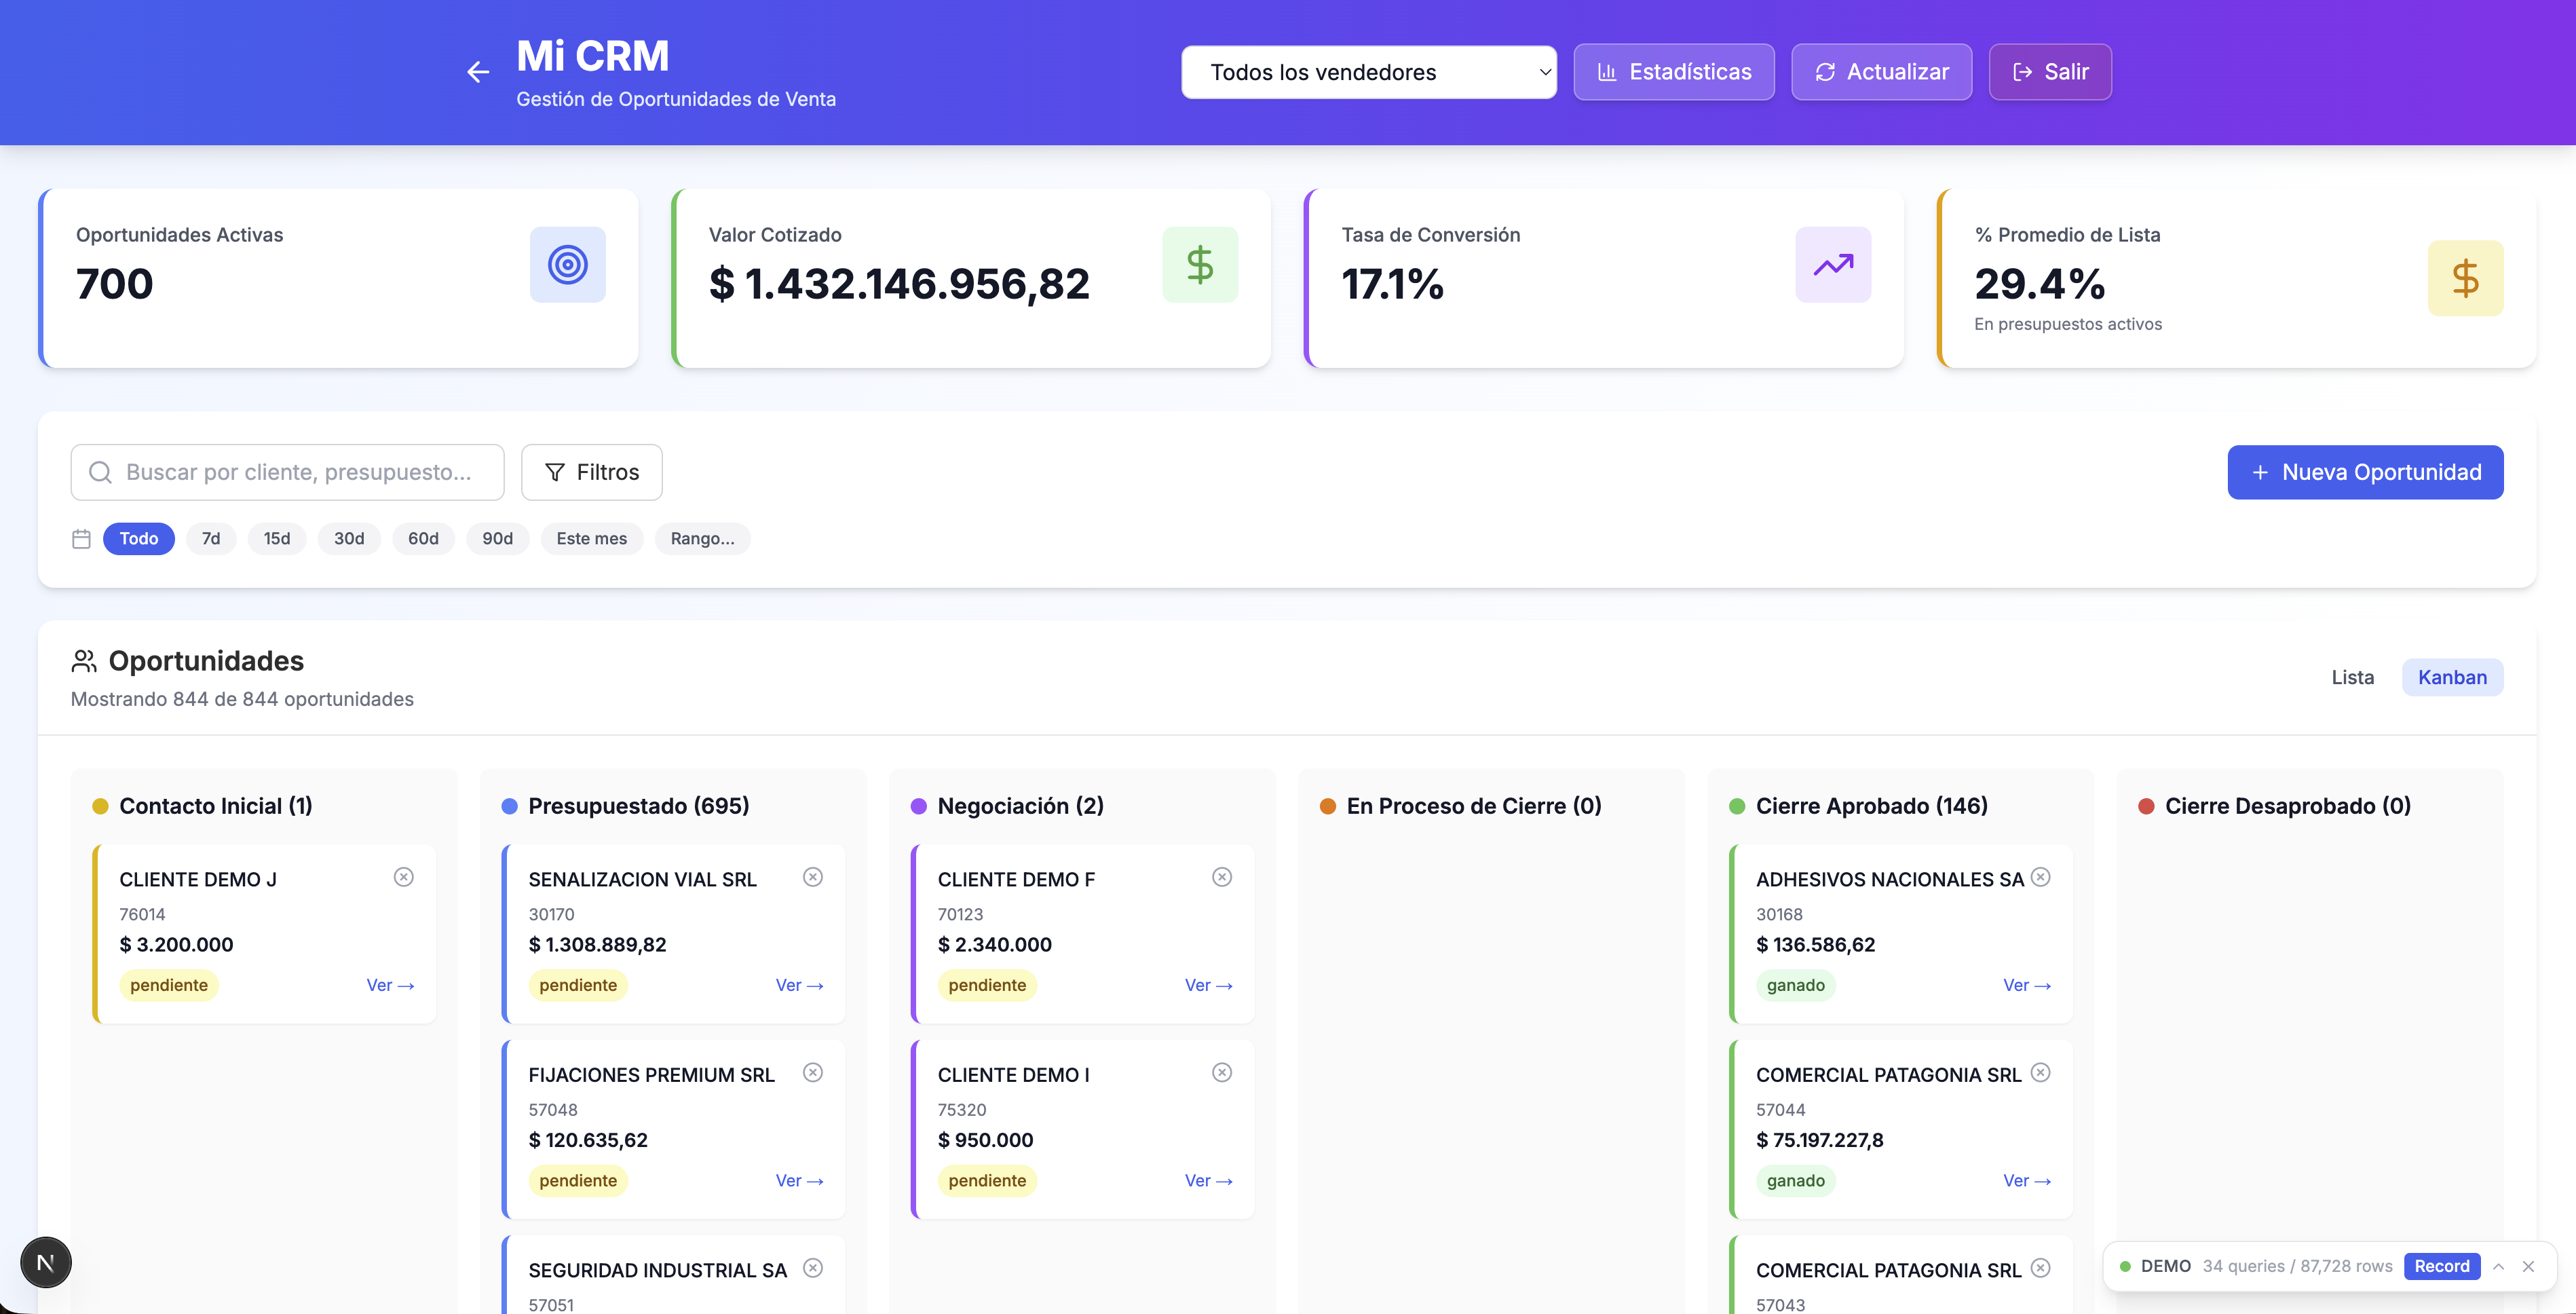
Building a Full-Stack ERP Intelligence Platform: From Legacy Database to CRM, Treasury & Cable Price Analytics
01mo ago
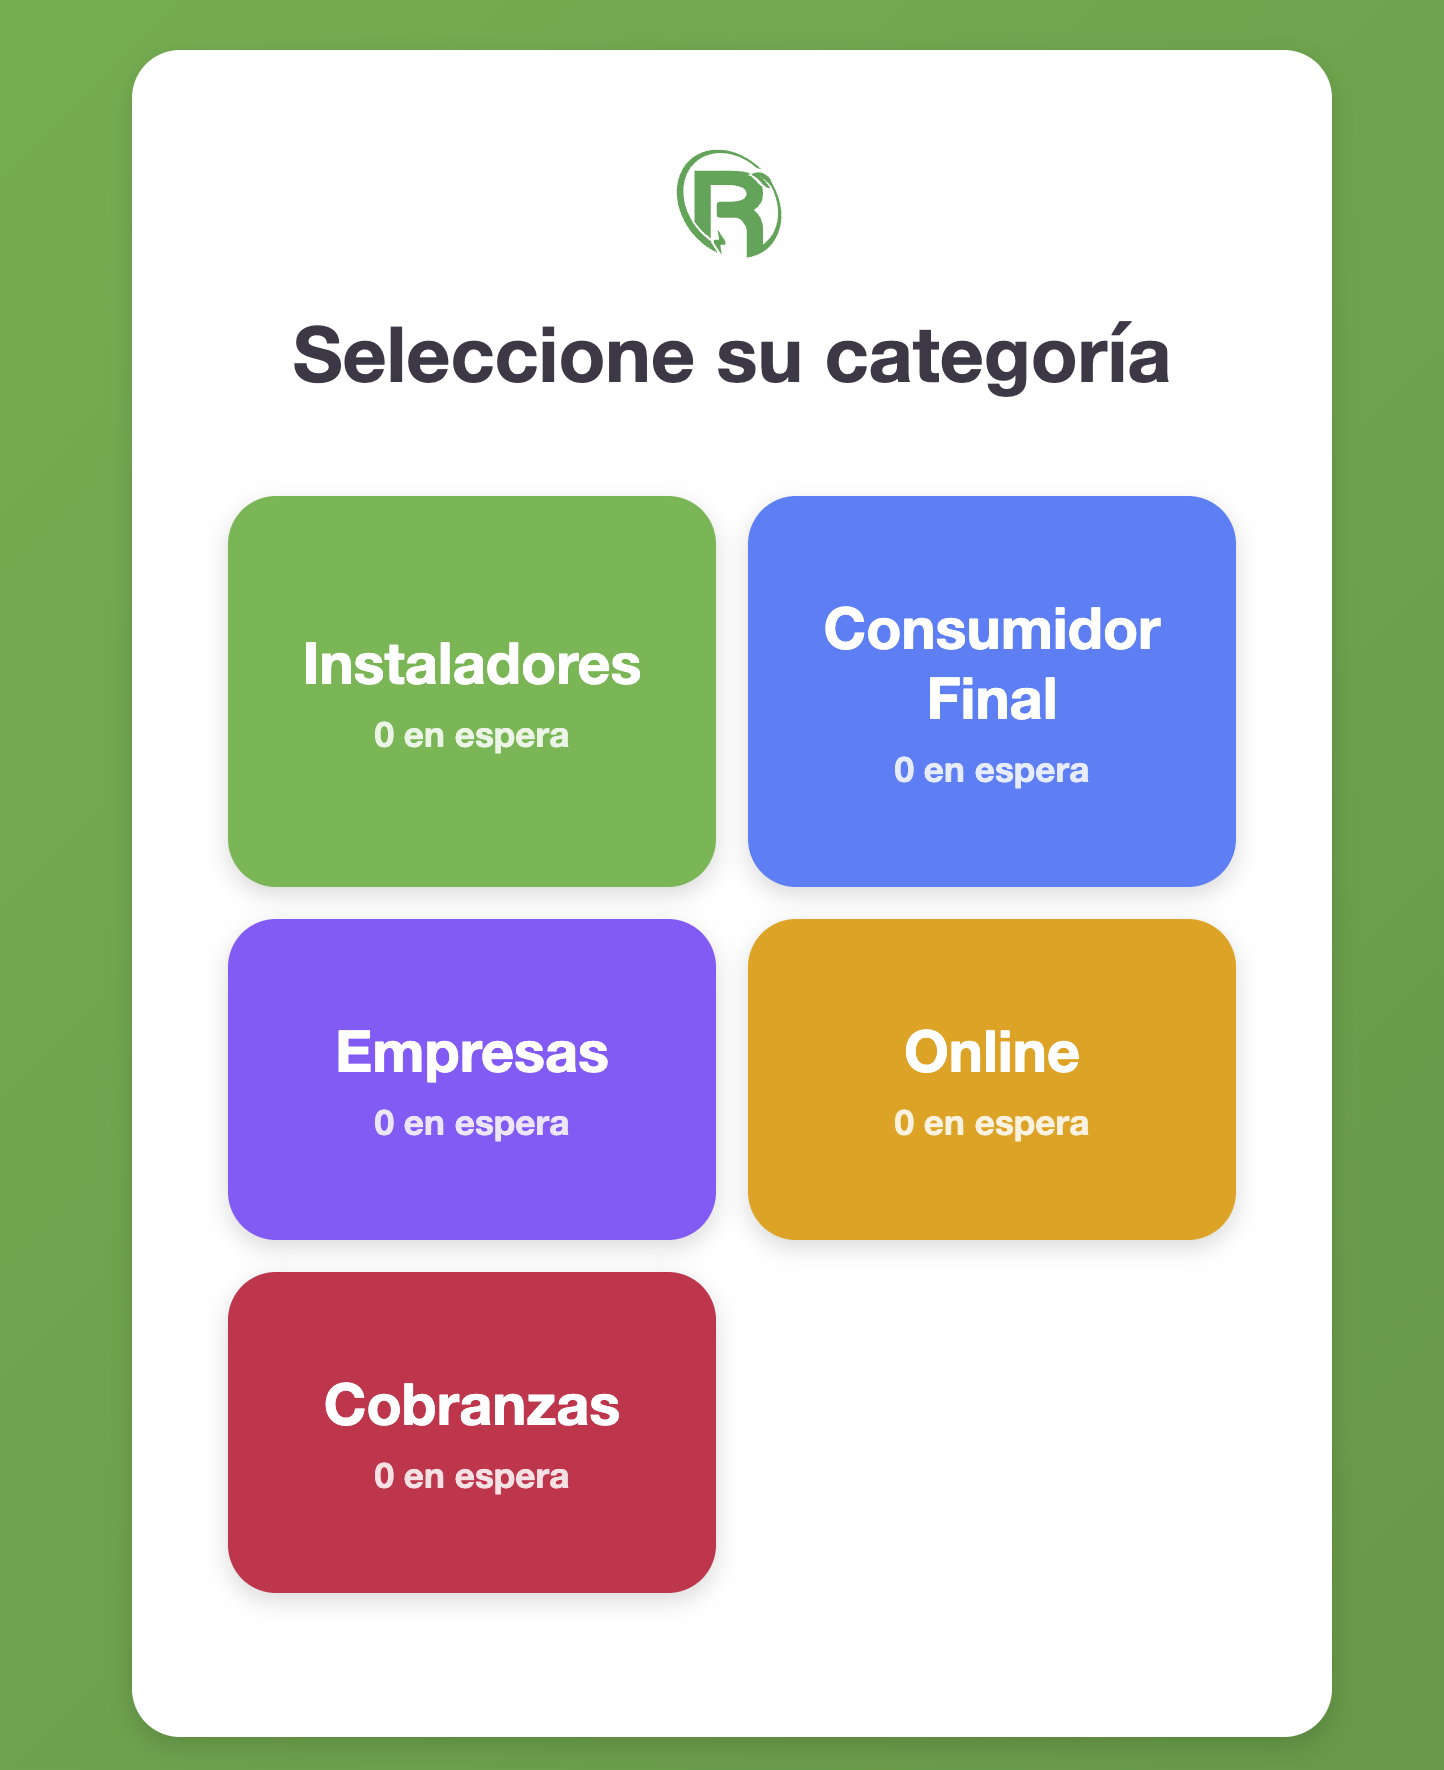
Building a Real-Time Queue System for a Shop on a Raspberry Pi with a Touchscreen
01mo ago

Redesigning a Guitar Teacher's Website: From Generic Landing to Online Class Machine
01mo ago
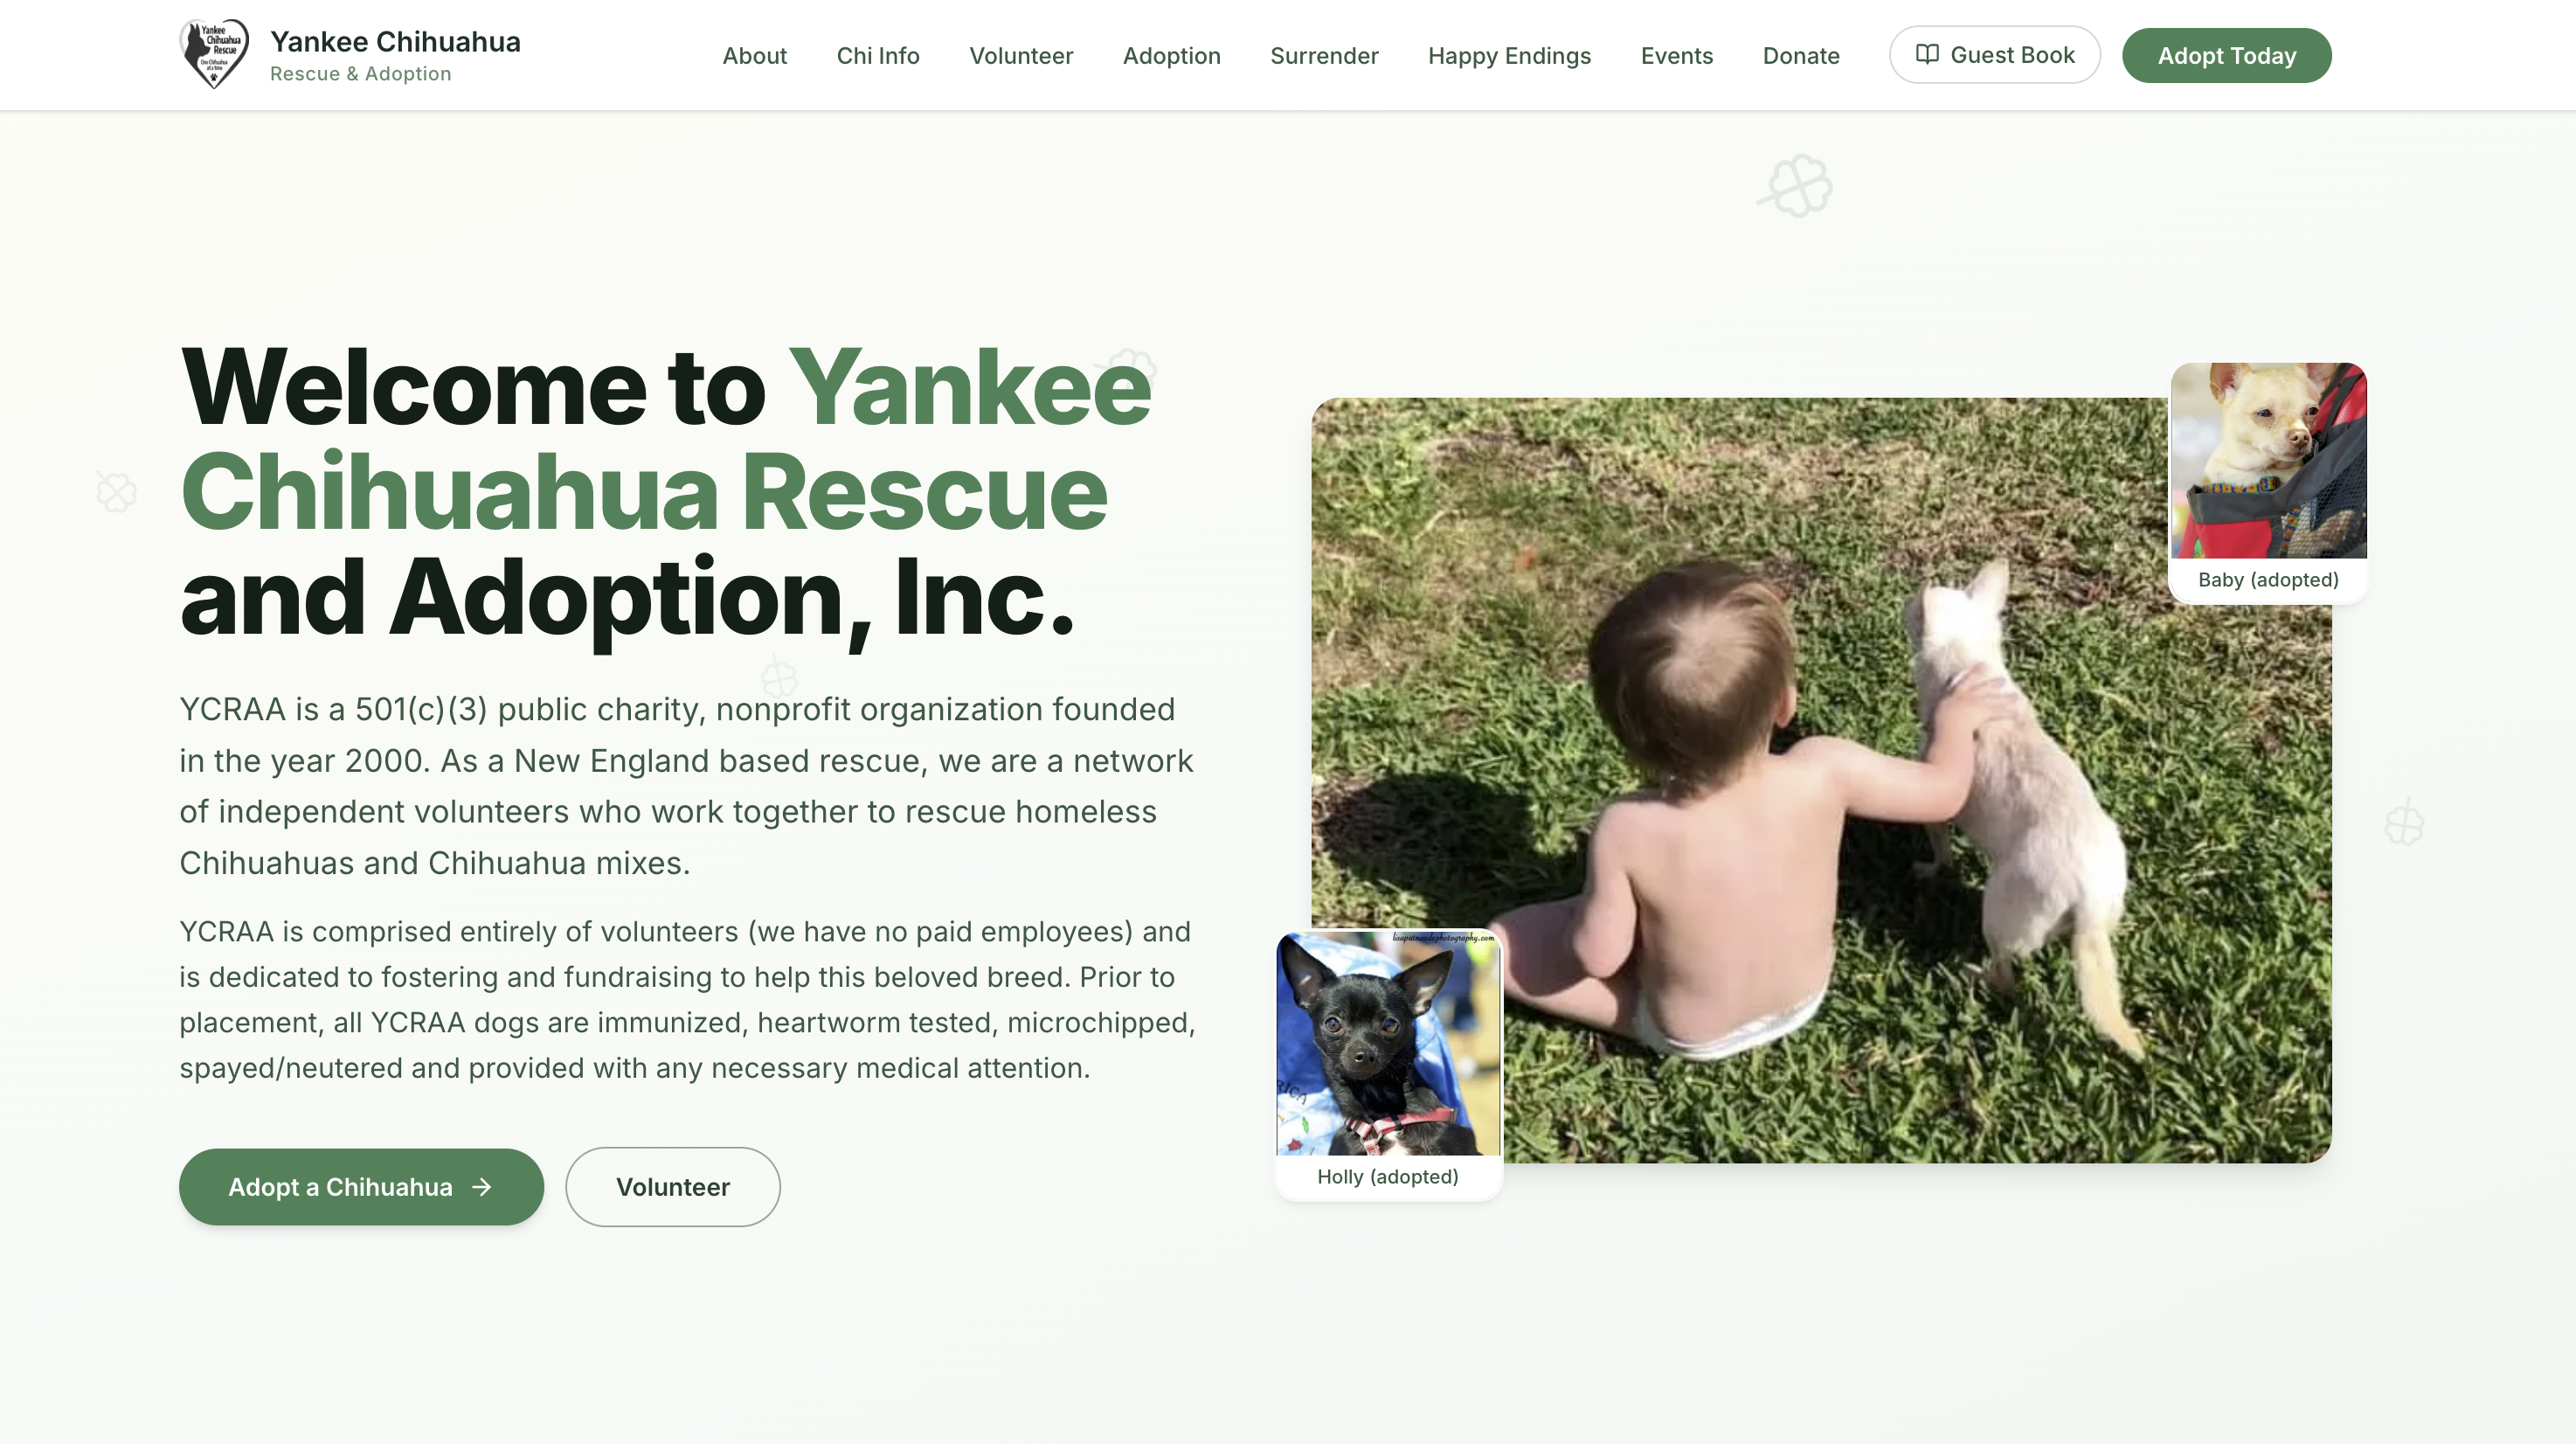
Rebuilding a Dog Rescue Website from Scratch: Scraping, Crawling, and Modernizing Yankee Chihuahua Rescue
01mo ago
B
Building First Commit: A Platform Where Vibe Coders Share What They Build
01mo ago
More like this
Building a Full-Stack ERP Intelligence Platform: From Legacy Database to CRM, Treasury & Cable Price Analytics
01mo ago
Building a Real-Time Queue System for a Shop on a Raspberry Pi with a Touchscreen
01mo ago
Redesigning a Guitar Teacher's Website: From Generic Landing to Online Class Machine
01mo ago
Rebuilding a Dog Rescue Website from Scratch: Scraping, Crawling, and Modernizing Yankee Chihuahua Rescue
01mo ago
B
Building First Commit: A Platform Where Vibe Coders Share What They Build
01mo ago